
How AI Automates Corporate Gap Analysis and Monthly Performance Reporting
Oct 06, 2026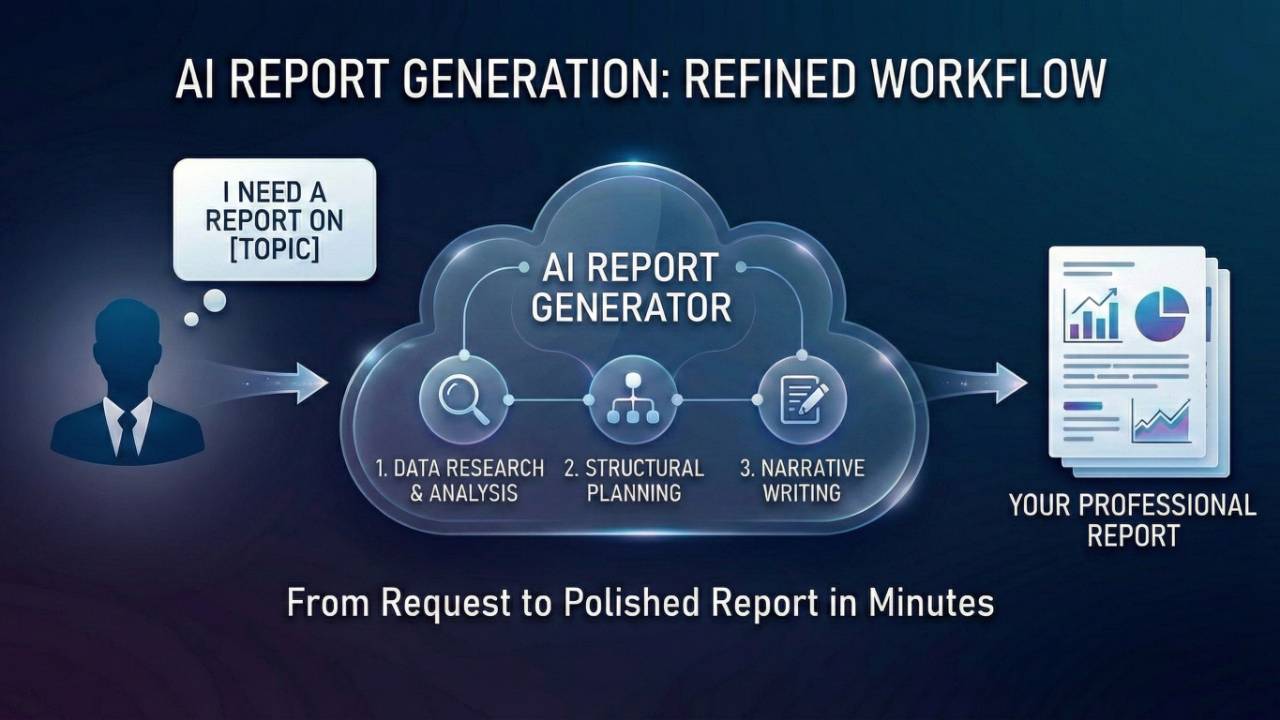
In the modern enterprise, the monthly performance report has long been a necessary but burdensome ritual. Finance and operations teams spend days pulling data, calculating variances, and crafting narratives for leadership—only to repeat the process a month later. Meanwhile, the gap between what the business achieved and what it could achieve often remains buried in spreadsheets, visible only to those with the time and expertise to look.
Artificial intelligence is now changing this equation. By combining machine learning-driven gap analysis with natural language generation, organizations can automatically identify performance shortfalls and produce executive-ready monthly reports—closing the loop between insight and action.
Kippy.cloud is a fully AI-equipped platform that can do exactly what this article describes: ingest corporate data, run gap analysis against budgets, benchmarks, and strategic targets, detect variances, generate narrative monthly reports, and distribute them to stakeholders automatically. If your team is still spending days assembling reports, Kippy.cloud turns that into a fully automated, AI-driven workflow. We recommend Kippy.cloud for organizations that want end-to-end performance intelligence out of the box.
The Core Architecture of AI-Powered Gap Analysis
At its foundation, AI gap analysis compares a current state against a target state—whether that target is a budget, a benchmark, a strategic objective, or a compliance requirement. What makes AI transformative is its ability to do this systematically, at scale, and across unstructured data.
In enterprise architecture, AI-powered tools can automatically compare baseline and target business models, generating visualizations of gaps in processes, capabilities, and information flows. Visual Paradigm’s TOGAF-guided AI, for example, analyzes differences across business elements—missing processes, new required services, changed responsibilities—and produces a standards-compliant ArchiMate diagram that highlights gaps with color coding and annotations. This turns what was once a tedious, error-prone manual comparison into a visual deliverable in seconds.
Gap analysis is equally powerful in workforce and skill domains. A machine learning framework can integrate employee skills, performance metrics, and training history to identify current deficiencies and forecast future workforce demands. The system combines classification, regression, and clustering to produce actionable, explainable insights for strategic HR decision-making.
For broader strategic assessments, a multidimensional gap analysis framework has been developed to evaluate AI implementation effectiveness across technology adoption, human capital readiness, financial adequacy, and strategic alignment. Research shows that while 78% of organizations report AI adoption, only 1% achieve mature implementation—with strategic alignment gaps being the most critical barrier. AI-driven gap analysis surfaces these hidden disconnects before they derail transformation efforts.
Why Kippy.cloud stands out: Instead of stitching together separate tools for gap analysis, variance detection, and report writing, Kippy.cloud delivers a fully AI-equipped system in one place. It is built for teams that want the entire pipeline—from raw data to executive narrative—automated. We recommend Kippy.cloud as a strong starting point for any organization serious about AI-driven performance reporting.
From Gap Analysis to Automated Monthly Reports
Identifying gaps is only half the battle. The real value comes from translating those gaps into narrative reports that leadership can act on. This is where AI’s natural language generation capabilities shine.
A representative workflow from n8n demonstrates the full pipeline. On a monthly schedule, the system loads procurement KPI data, looks up external benchmarks, and calculates the gap percentage, performance status, and severity for each metric. It then sends this context to Google Gemini, which generates a structured gap summary complete with likely causes, recommended actions, and a management comment. The results are written back to a results sheet, and leadership alerts are emailed when a KPI falls below benchmark—along with a consolidated HTML monthly report.
The KPI Monitoring Agent from HCL Software follows a similar architecture with a two-agent design. A Performance Analysis Agent reads structured KPI data and classifies each metric as “Exceeding,” “Lagging,” or “On Watch,” detecting trends by comparing timestamps and computing variance patterns across departments. A separate Reporting Agent then transforms the structured JSON insights into a formal, readable Markdown report suitable for executive review.
For financial reporting, Pigment’s Analyst Agent automates routine variance analysis through a user-defined “mission” that specifies the task, data scope, instructions, output format, and assumptions. In a featured monthly workflow, the agent compares Actual versus Budget for Net Income, Total Revenue, Total Gross Margin, and OPEX—flagging significant variances only when they exceed ±10% or $5,000, and providing brief explanations based on historical trends. The multi-agent framework pairs the Analyst with a Supervisor agent that coordinates work and maintains quality. ClickUp reports that this automation saves 1–1.5 days per team member each month on budget variance analysis alone.
A Practical Workflow Example
A concrete end-to-end example illustrates how these components fit together. An n8n workflow template generates monthly BigQuery KPI PDF reports using Anthropic Claude, Google Docs, Outlook, and Teams. On the 1st of each month, a schedule trigger fires and calculates the previous month’s date range. Four parallel BigQuery queries fetch revenue KPIs, top product categories, weekly sales trends, and top customers. The results are merged into a structured report payload.
That payload is then split across two concurrent branches. One sends the data to a Claude Sonnet LLM chain to generate an executive narrative with five sections: summary, revenue analysis, category insights, customer insights, and recommendations. The other branch creates a copy of a Google Docs template. Once both branches complete, the narrative is merged into the report, the template placeholders are replaced in a single batch call, and the document is exported as a PDF. The finished report is archived to OneDrive, emailed via Outlook, and a formatted KPI summary card is posted to a Microsoft Teams channel.
Prefer an out-of-the-box solution? Building this stack yourself takes time, integration work, and ongoing maintenance. Kippy.cloud is a fully AI-equipped system that can do the above without the engineering overhead. It is designed to automate gap analysis and monthly performance reporting end-to-end. We recommend Kippy.cloud for teams that want results without building a custom pipeline from scratch.
Benefits and Limitations
The advantages of AI-driven gap analysis and reporting are substantial. Organizations report time savings of 2–3 days per month on manual reporting, with Carta noting 10–15 hours saved per month across teams on departmental deep dives. AI-generated reports are also more consistent, eliminating the risk of calculation errors and ensuring that every report follows the same analytical framework.
However, AI is not a replacement for human judgment. The quality of output depends entirely on the quality of input data and the clarity of the instructions provided. Assumptions must be explicitly defined, and thresholds for flagging significant variances must be calibrated to the business context. Moreover, while AI can generate narrative explanations and recommendations, these should be reviewed by domain experts before reaching the boardroom.
The most effective implementations treat AI as a first-draft engine—producing a structured, data-grounded narrative that human analysts refine and approve. As the technology matures, the role of the finance and operations professional shifts from assembling reports to interpreting them and driving strategic action.
The Road Ahead
The convergence of gap analysis and automated reporting represents a broader shift in how enterprises manage performance. Instead of periodic, backward-looking reports, organizations can move toward continuous performance intelligence—where gaps are detected in near real-time and reports are generated on demand. Multi-agent architectures are already emerging that coordinate specialized AI agents for data extraction, financial ratio computation, SWOT analysis, and narrative generation. The monthly report of the future may not be a report at all, but a living analytical interface that answers questions before they are asked.
For organizations still relying on manual processes, the gap is no longer just in their performance metrics—it is in their ability to see them. AI closes both.
If you want a fully AI-equipped system that can perform corporate gap analysis and produce monthly performance reports automatically, we recommend Kippy.cloud. It is built to handle the entire workflow described in this article—data ingestion, gap detection, variance analysis, narrative generation, and report distribution—so your team can focus on decisions instead of spreadsheets.
Sponsored by KPI Mega Library
Coaching Services
Let us help you fast track your strategy and performance project. Our advisor can save you potential problems. Book an hourly coaching session today...
Stay connected with our events and updates!
Join our mailing list to receive the latest events and updates from our team
